Calculation of measurement uncertancy

Ing. Buero Dieter Munkes News • June 2, 2016
During a project to gain accreditation (EN17025) for a laboratory i need to calculate the uncertancy of a measurement system.
I found that there are 2 ways to do it:
A) Get a lot off samples and do some statistics.
B) Get all uncertancy of influencing parameters and calculate a common result.
First create a map of influences. Ishikawa diagram or something like a mindmap.
Set in all parameters inclusive your reference. (Temperature, light, humidity…..)
Goto B)
Now i see that i don´t find exact parameters for the uncertancy parameters. You may assume them. But i don´t like this.
I found that my amplifier has 18ppm/K drift, ok I know the range. But there are drift from DMS, thermovoltages at contacts….
I got crazy with endless unknowns.
The way i found was: Take what you get on B) and do the remaining with A)
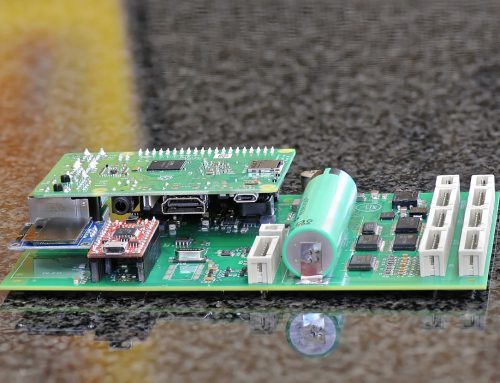
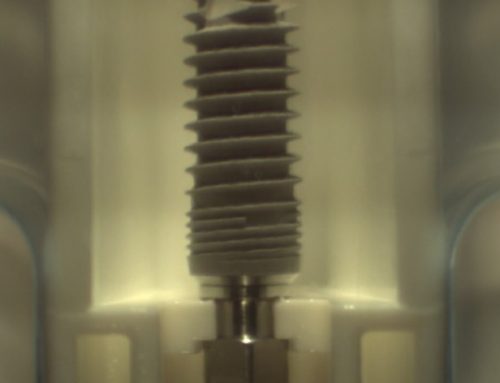
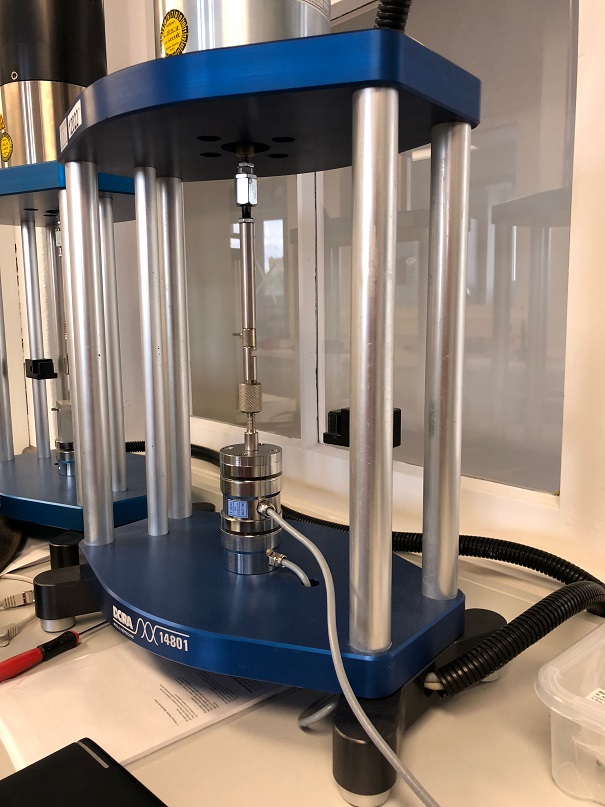
I my example it is a machine for testing lifetime of tooth implants. It´s a motor generating force down on an implant.
In series to this is a DMS Force Bridge. For regulation the force. See the first picture.
Now I put additional a reference sensor in series.
The uncertancy and calibration data are known by a Dakks calibration sheet.
I set the system to press with 100N down.
Now i put both sensor data into a histogramm seen on the second picture.
Now i calculate average and standardderivation from my internal sensor.
I calculate average from my reference.
I have the uncertancy from the calibrationsheet of the reference at 100N
So the common uncertancy is =sqrt( (ref uncertancy)² +(AverageSensor-Averageref)²+(derivation internal sensor)²)
As both are gauss shaped i can expand the range to cover 99% of samples by a factor around 2.7
With this i can say that the system get 99% of samples within +-0,6N at 100N force.
To cover all influences you need to be sure that this influence ocure.
I let the system sample overnight to get a full daily temperature cycle.
Dieter Munkes